This Article Applies From:
DeMeter2.14. | Other Applicable Versions |
Introduction
The present article purpose is to introduce about the usage of the Smart Alert and to teach about the usage of the Smart Alert configurators so you can have a broad idea on how to configurate your own Smart Alerts, either for testing purposes or to provide a solution to a customer.
1 - Pre- requisites
1.1 - Suggested readings before diving-in
We advise you to read some of the following
1.2 - Software Prerequisites
You will need a version of DeMeter that support Smart Alert (2.15+), that imply that you have a server with the hardware and software requirements appropriate for DeMeter itself.
You will also need a text editor for the configuration of DeMeter files.
2 - Smart Alerts
2.1 - Definition and purpose
Smart Alerts are a new feature within DeMeter allowing you to configure certain scenario that will raise an alert if criteria are met. Some examples of scenario where it is possible to configure a Smart Alert include :
- Raise an error when the Ratio of NOK tightening in the last 10 tightening of a specific unit is superior to 50%.
- Raise an error when there is too many alerts of a certain type (ex: WARNING) during a limited span of time
- Raise an error when the production seems to be slowed down
With Smart Alert, you can bring your monitoring to another level, having the possibility to make tailored alert that suit your specific needs without the need to be flooded with information. The configuration of the Smart Alert themselves are also quite easy to do, and do not require extensive programming knowledge.
2.2 - Component
Smart Alert is separated into 2 different component, each of them fulfill a particular role. Both of them works independently of each others, and in different environment. In addition to this, the DeMeter server must be correctly configured with the creation of a Smart Alert folders in the Desoutter folder on the server (this should be done automatically). This folder settings file and the modification of the "appsettings.json" to activate Smart Alert in the parameters and to provide the path to the directory containing the Smart Alerts.
Both of the 2 packages can be downloaded at the usual distribution sources, you will find 2 separates zip that contain one of the 2 components.
2.2.1 - Smart Alerts Configurator
The configurator of Smart Alerts is a program that allow you, like its name indicate, to configure your Smart Alerts. The usage of the configurator should be reserved to technical member of the support that have been formed. While Smart Alert is still in early access, the configurator should not be installed at the customer's site at all. This is to ensure that the customers can focus on
The creation of a Smart Alerts is done with an arrangement of node linked between them, the details of the node and the general architectures of a Smart Alerts will be explained in more details in the third section of this article.
Once you have the desired Smart Alert it can be exported as a json file. Said json must next be imported by on the DeMeter server. The operation is more detailed on part 4.
2.2.2 - Smart Alerts Engine
Smart Alerts Engine is a service which purpose is to work with DeMeter to detect if an alert should be raised or not, depending on the scenario loaded onto DeMeter. The service must be executed on the DeMeter server for obvious reason, and it will communicate with DeMeter through the DeMeter Broker (port 1883) so that he can access the database and send its own alert to DeMeter. The location of the program file of the engine should be the following for a proper installation :
"C:\ProgramData\Desoutter\SmartAlerts\SmartAlerts_Engine"

3 - Smart Alerts Configurator
3.1 - Main menu

Once launched, Smart Alert Configurator will open a new windows on your default browser. This window represent a giant canvas where you will be able to connect nodes between each other. The first bar presented to you is the Document bar, the options presented here are just for the manipulation of the Smart Alert document files.

The Smart Alert document is by itself a json file describing every node and their connections, as such exported Smart Alert (using the 'Save' option) can be reimported to be further worked on with the Load options above the 'Alerts Configuration'. The other load option is used to load an exported DeMeter configuration, doing so is highly recommended as it allows the configurator to preset some options such as the line layout in some of the nodes. The last section, 'Verify' serve to check if the minimum parameters to make the Smart Alert work are settled.
3.2 - Node objects
This section will present the different nodes in the configurator, what kind of data it manipulates and what can be their usage for your needs. Every nodes will present some dot on their left and right side. Dot on the left represent input taken by the nodes while dot on the right are the output of the nodes, by linking the nodes using these dots, the configuration of Smart Alert can be really easy to do.
3.2.1 - Smart Alerts Category

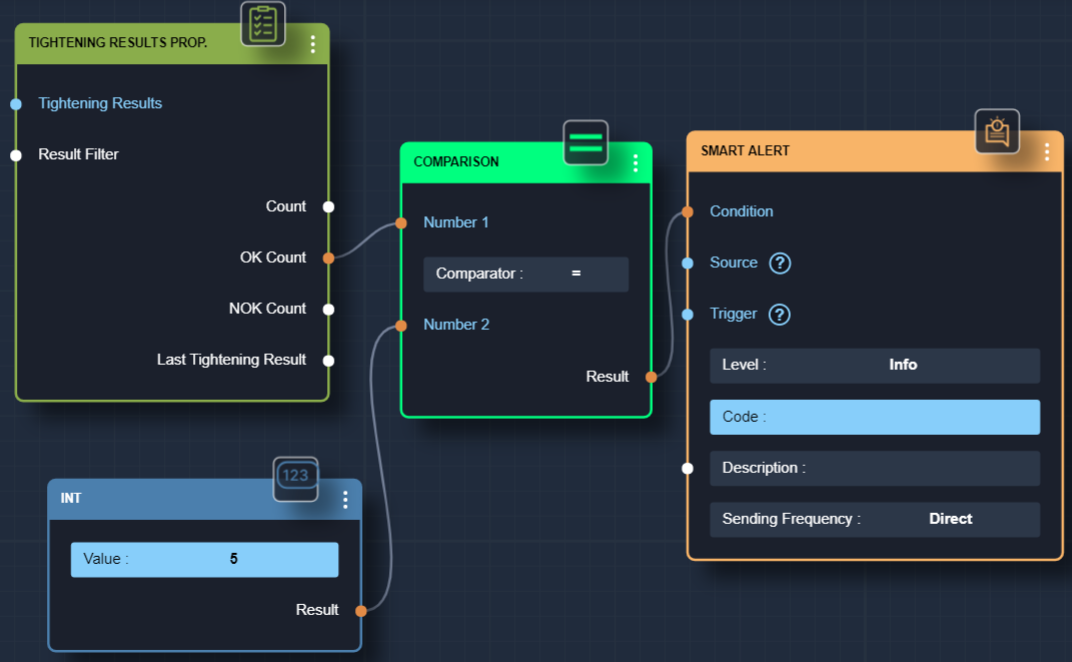
The first category of node we're going to see is the 'Smart Alerts' nodes. These nodes are the backbone upon which our SA is built as you will need at least both a trigger and a Smart Alert node to make a functioning Alert. There are 2 types of node in this category, the Smart Alert node and the trigger nodes. The Smart Alert node is the 'central' node, it serves as the base where every other nodes will be connected or indirectly connected. The 'Condition' field will receive a boolean value indicating if an alert should be raised or not, nodes that are built ahead of this field will determine the condition of your Smart Alert. The 'Source' field is used to localize the source of your Alert within the production line, this field will receive the identity of a working Area, a tool or a connect. The 'Trigger' field meanwhile is used to know when the SA should test result in order to determine if an alert should be sent, it takes as entry special trigger node that will be showcased later in this article.

The triggers options presented in this category allow you to configure different kind of trigger :
- Clock Trigger will run the alert once per day at the given hour
- Timer trigger will run the alert every X amount of time, giving you the choice of the frequency you wish to test your alert
- Alert, Tightenings and Curve Analytics trigger are document trigger, they will run the Smart Alert whenever a new document corresponding to their type are received in the RavenDB database. Additionally, it is possible to add filter before theses nodes to further reduce the amount of time the Smart Alert would be triggered.
3.2.2 Zone & Area
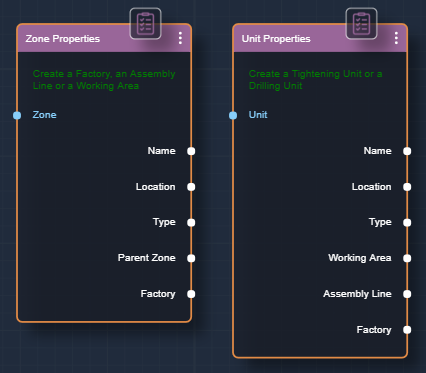
The 'Zone & Units' node are used mainly to provide localization inside the production line with a varying degree of precision. These type are nodes are mainly used to provide localization information to the Smart Alert and to narrow down the amount of data treated inside a Smart Alert.

There are currently five different degrees of precision within the 'Zone & Area' nodes : Factory, Assembly Line, Working Area, tightening product or infinity station and finally you can look at a specific TU if you wish. Whichever node you pick is up to your need, and it is possible to combine multiple of these node in a Smart Alert to get some interesting hindsight (example : A smart Alert that is triggered by any Non-Ok result within a working area and that will check the historic of the Tightening Unit that triggered it).
Finally, if you wish to use specific information about the areas or the TU, you can use their respective Properties node, that contains information such as their name, location or parents.
3.2.3 Data Sources
The 'Data Sources' category provides tool to gather and analyze data in your Smart Alert giving you more flexibility in term of possible scenario to analyze. We can divide the nodes of this category in 2 : the nodes that will return the data, and the nodes returning the properties of said data. The 'Tightening' and 'Alert' node will return the last result of either data 'type', it is possible to provide a localization to fetch only result on a precise point in your line layout or to put a filter (much like the trigger) to only select the data if it provides any interest to you. Both of these nodes have a variant that allow to return several document of their types, the 'Tightenings' and 'Alerts' node. These nodes can have filter applied to them to make more precise search within the tightening or alert database.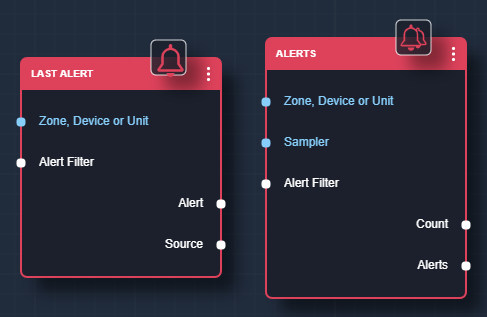
You can also include in your alert the properties node attached to each object to have more information to work with. Note that you can exploit way more properties from a single result rather than a sample of them.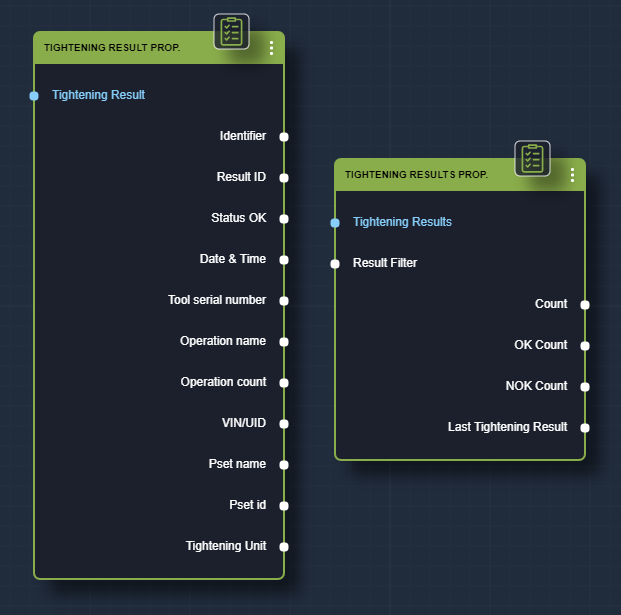
3.2.4 Data Filters

The other nodes in this category are the filters node, they should be put before any node returning a list of alerts as they serve to filter them through various properties belonging to the alert (example : alert level, code...). They can also be put before a Trigger node to restrict the activation of the Smart Alert. It is possible to filter on many parameters such as the PSET of an operation or the level filter of an alert.
3.2.5 Math & Texts
The Math & Texts node are used to calculate specific value such as a sum, a ratio or a minimum for example. They always take 2 entry which can be provided by another node or manually fielded, and it will return the result of the wanted computation between the 2 entry.

Here is the list of mathematical operations that can be included in your Smart Alert :
- Addition
- Multiplication
- Substraction
- Division
- Return percentage of the ratio of 2 values
- Return minimum of 2 values
- Return maximum of 2 values
Furthermore, there is also some node that can be used to operate on string such as :
- Compare two strings
- Concatenate two strings into one
- Search for a string in a list
3.2.6 Logical Nodes

The main nodes that you are going to use is the 'Comparison' and 'Interval' where you can either check if one value such as the number of results is equal to an arbitrary value or if it belongs to an interval. The use of the other node in Logical Operation is to combine other results or inverting them if you want the alarm to be raised in the opposite of a situation.
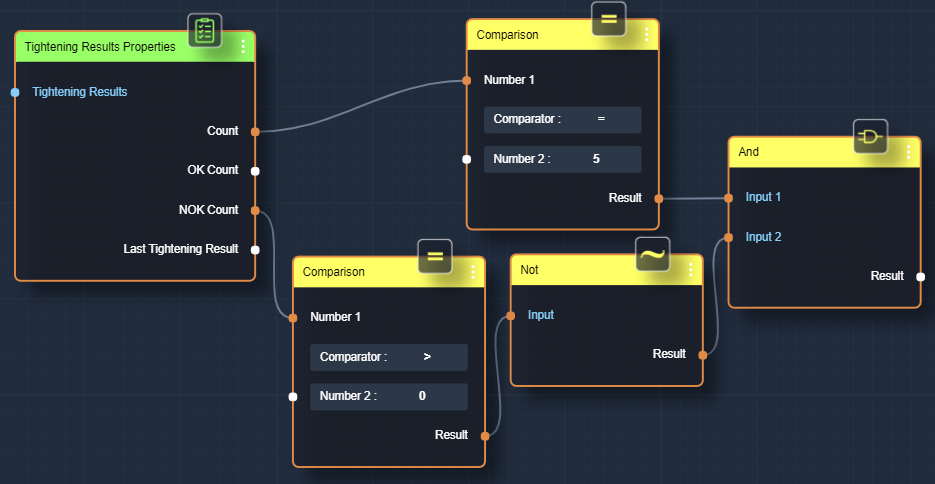
3.2.7 Values nodes
Finally, we have the values node. Values node simply serve to provide values of their type as an output. This would usually be used to setup manually some fixed threshold or to recognize some specific text. There is also the possibilty to use these nodes for making debugging test.

3.3 - Creating your first Smart Alert
While it is recommended to use a demo file first to better understand the Smart Alert system, you might want to create your first Smart Alert from scratches. Here is a detailed guide to do so
To create your first Smart Alert, you will need at least 4 mandatory elements :
- A Smart Alert node, connected to the 3 other element below
- A trigger node
- A data source
- And a condition
Once you have opened the configurator page, navigate to 'Objects' tab by clicking on it and select 'Smart Alerts'. You then drag and drops the 'Smart Alert' node onto the main panel of the page.
You'll need then to link the trigger, data source and condition node to their respective entry on the Smart Alert nodes. Check the validity of your Smart Alert using the 'Verify' button on the Document bars and finally save it using the 'Save' button on the same bar. This will download your Smart Alert as a json file on your computer.
The following example is a great way to test the feature, here the sources node have been substituted by the information of tightening unit of the last tightening result that triggered the alert.
4 - Setting up your Smart Alert within DeMeter
As a prerequisite, you need to have a recent version of DeMeter that support Smart Alert, and to have Smart Alert enabled within the appsettings.json file by adding "SmartAlert": true to the config file.
Once you have finished editing your Smart Alert and exported it, it is time to import it through DeMeter :
- Move the smart alert json file to your server
- Open the DeMeter Configurator in your browser
- Expand the Navigation Menu from the top left, click on the arrow next to Alert Manager to display a list and go to Smart Alert.
- Click on 'Import' button and then load your json file through the interface

- If the Alert status is stopped, click to enable it
- Click on the save button at the top right of your screen
- Return to the Home page and apply your configuration
If the Smart Alert Engine is stopped, you'll need to start it, but otherwise your Smart Alert should have been taken into account (it is possible to check the logs of the Smart Alert Engine to see if your alert have been registered successfully).
If you're using the example Smart Alert made on the previous sections, you can test it by making any tightening with any tools that are connected to your DeMeter. You should see an alert appearing everytime you do so. Once you're done testing, you should be able to close all the raised alert by going into any alert dashboard (or by closing alert in the Diagnostic>Open Alert page) on your DeMeter server. Do not forget to disable or delete your alert if you don't use it anymore.
5 - Debugging your Smart Alert
There will be some time where your Smart Alert will not be working accordingly to the design, and you will have to look at the reason why. The logs found within the Smart Alert logs can give some indication, alternatively, you can stop the Engine and run it in Console mode to have the current logs written directly on a Windows terminal.
You should also deactivate every other alert beside the one you're trying to troubleshoot, this will help in terms of visibility when scrutinizing the log. You will then want to test one fundamental thing, is your Smart Alert reacting to the trigger you choose. Just make a new tightening or raise an hand on alert and look at the log to see if the engine react to it. If there is no new output from the log, something might be wrong with your configuration.
If the logs file react with the output of numerous lines and with an end result containing false or true, you will have to investigate further by looking at the state of the different node, represented as block. This allows you to check the different value each node received in entry and to pin point precisely the issue, though it can be hard to decode itself.

