This Article Applies From:
CVI Fusion8.2.1 | Infinity Client8.2.1 | Infinity Module8.2.1 | Core Services8.2.1 | DeMeter25.1.2 | CVI32.6.6.7 | Connect 2.6.6.7 | Earlier revisions |
Introduction
DeMeter can retrieve and display in a dedicated dashboard all alerts raised at any station on the factory floor.
This article intends to bring you an insight on the configuration process, and how DeMeter can help you leverage an efficient overview of unplanned events either for Pivotware or Tightening Devices.
Contents1.1 - Suggested readings before diving in 2.2 - Configuring Tightening Alerts 2.3 - Configuring Pivotware Operator Calls 2.3.1 - Creating an Operator Call |
1 - Pre- requisites
1.1 - Suggested readings before diving-in
Please be sure to read the following articles if you wish to fully benefit from the present article:
1.2 - Related articles
The following articles are also related to the current topic:
2 - Setting the alerts
2.1 - Alerts overview
DeMeter allows you to retrieve alerts from two different sources:
- Desoutter Tightening systems: alerts raised by any Desoutter tightening system can be retrieved by your DeMeter server. However, to keep the focus on the events that are the most significant to you, it is possible to restrict the display only to a number of alerts, and disable the others.
- Pivotware Operator calls: operator calls raised at any Pivotware station can be retrieved by DeMeter and displayed in the same dashboard than as those raised by your Desoutter Tightening systems.
Regardless of the source, all alerts share a common set of characteristics:
- Alert level: this is the severity of the alert. When an alert with either an Error or Critical criticality is raised, DeMeter will assume the line to be stopped. DeMeter will only consider the production to have resumed once the alarm has been cleared.

- Alert category: this is best described as the key role (maintenance engineer - quality engineer - ...) at your facility who should be in charge of acting upon receiving the alert.
 Categories are useful when used alongside the DeMeter Assistant app: each key role at your factory will be able to choose which alert category he wants to be notified of.
Note: default categories for both alert sources are different.
2.2 - Configuring Tightening alerts
2.2.1 - Pre-requisites
Make sure that all your Desoutter tightening systems are setup to send User Info to the Demeter server.
The exact procedure is described in the Configuring Desoutter tightening tools for operation with DeMeter article.
2.2.2 - Setup
All existing alerts for a Desoutter tightening system come pre-configured with one or more Category, but also an Alert level. Both these settings can be altered to match your needs.
In order to fine tune said alerts, and chose the one you need to see reported:
- Open Demeter Configurator using your favourite web browser (see Accessing DeMeter configurator ).
- After unlocking the configurator, expand the Alert Manager menu then click Tightening Alerts.

Note: if you wish for notifications to be transferred to your mobile phone running the DeMeter Assistant installed on your mobile phone, be sure to toggle on the Upgrade to Smart notifications Add-on button. If the button remains off, notifications will not be transferred to connected mobile phones.
DeMeter will start reporting all alerts for a cost of 100UV upon toggling the Activate Notifications switch, saving then applying the new settings.
Furthermore, each individual alert can be tailored to adapt to the best practices put in place at your factory:
- Visibility Flag: each alert can be set to be either Visible or not. Checking the corresponding check box will allow the alert to be reported by the Demeter server, while the alert will be discarded when leaving it unchecked.

- Alert level: each alarm can be set to match your preferences by clicking on the corresponding drop down menu then choosing the appropriate level.
 Note that this setting is applied to DeMeter only and will not be locally applied by the controllers (i.e. the user info level displayed at the controller level will remain the same).
As previously stated, Error and Critical alerts level will be considered stopping events by DeMeter, and the corresponding report will reflect this (please refer to our Dashboard Metrics article). - Categories: it is possible to edit the category associated to an alert. Categories associated to an alert can be removed by clicking the "X" next to the category name, and other can be added by expanding the drop down menu and selecting the appropriate one. It is also possible to start typing the name of a category: a list of suggestion matching the first few letters will directly be suggested by the configurator.
 If you feel that none of the existing category matches your needs, you can create a new one by typing in the appropriate name then hit enter. As a result, a new category gets created and will be available for selection for all other alerts (including Operator Calls for Pivotware).
Keep in mind that the selected Category will be used as a KPI to highlight which alert type is the most raised for a specific line.

2.2.3 - Bulk configuration
The above process can be time consuming when run for each Alert individually. To simplify the process, all available alerts can be bulked edited via an Excel file, then imported back to DeMeter.
- Open the Tightening Alerts panel from the DeMeter configurator window.
- Click on the "+" sign at the top of the alert list.

- Click on Export CSV File (an example is attached to the present article: demeter_manage_alerts(1).csv).
- Open the exported file using Excel or a similar software: it is now possible to edit the Visibility, the Level and the Categories directly from the excel file.
Note that:
a- Visibility can be either set to 0 (not visible) or 1 (visible).
b- Level can only be set to Info - Warning - Error - Critical.
c- A line feed must be inserted between two categories for them to be taken into account. - Save the file once you are satisfied with your changes (be sure to keep it in CSV format) then go back to DeMeter Configurator. Click the "+" once more then select Import Csv File and select the previously edited file.
The list of alerts will be updated with the changes done. To apply said changes, simply save the changes from the browser menu then apply to the DeMeter server.
2.3 - Configuring Pivotware Operator Calls
Pivotware operator calls can be configured and shared through the whole factory floor via DeMeter.
2.3.1 - Creating an operator call
As opposed to the Tightening Alerts, Operator Calls can not be disabled, i.e. as soon as an operator call is raised, it will be displayed in the corresponding dashboard.
- Open the Operator Calls menu from the DeMeter configurator interface.
- Click "+" sign.

a- The Operator Call name.b- The Alert Code for each Operator Call
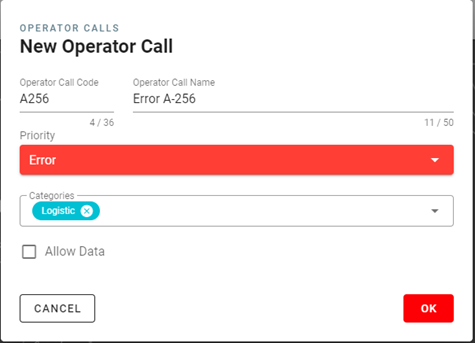 c- The Operator Call priority: it can be set to Info - Warning - Error - Critical.
d- The Operator Call characteristics: it is possible to select an existing characteristics from the drop down menu, or to create a new one by typing a new characteristic name and hitting enter.
e- Choose whether to Allow Data: when enabled, the operator at the Pivotware station will be required to provide additional information about the raised call. This information will be available for display in DeMeter.
Click OK to complete the Operator Call creation process, then Save your configuration and finally Apply your settings to transfer them to your DeMeter server.
The Alert Code will then be visible in the Alert List widget or the Worst Alerts/Connectors widget.


All Pivotware stations setup to retrieve Operator calls from DeMeter will retrieve the full list of alerts and make them available to the operator.
Note: Pivotware station setup as to retrieve this setting from DeMeter will not have any Operator Call configured if communication to DeMeter drops.
2.3.2 Creating sub-calls
Each Operator Call can be assigned a number of sub-calls.
By default, a sub-call inherits its characteristics from its parent settings. However, even that can be updated.
To create a sub-call:
- Browse the configurator to reach the Operator Calls.
- Click the three dots next to any operator call to reach the additional configuration menu:

- Click on Add Sub-Call in the menu that opens.
A new menu opens to allow you to configure the new sub-call.
If the Inherit From Operator Call option is checked, it is only necessary to provide a name for the sub-call then click OK.
If the Inherit From Operator Call option is unchecked, all characteristics need to be updated before saving the new sub-call. However, any additional category also needs to be created at the parent level.
Once the required Sub-calls have been created, save then transfer the configuration to the DeMeter server.
An operator raising an alert at a PivotWare station will then have to choose any of the sub-calls configured at his workstation.
3 - Alerts and Operator calls dashboard
Dedicated dashboard and widgets allow you to display in real time active alerts, but also monitor the most frequently raised issues.
This section intends to give you a short overview of the various available widgets, and provide some description on their possible use. Before diving into it, though, be sure to read through the Working with dashboards in DeMeter article on our portal.
3.1 - Live alerts
A dedicated widget called Open Alert can be added to any Dashboard: it will display all alerts that habe not yet been acknowledged / resolved.
In order to use this widget:
- Open / Create the Dashboard you wand to add the widget to (see Working with dashboards in DeMeter).
- Type Alert in the widget search bar then drag and drop the Open Alerts widget to your dashboard (keep in mind that your dashboard should have enough space left).

Save then deploy the new configuration.
As a result, any Alert or Operator Call raised on a production line will get displayed, alongside the Device it is associated to: this allows you to quickly locate the fault for a swift resolution.
As soon as the Alert or Operator Call condition is cleared, it will disappear from the display.
3.2 - Alert monitoring
The following widgets allow you to monitor overtime the most frequent issues encountered at your factory:
- Alert Categories widget: the widget will aggregate the categories of alert raised over a whole factory, a whole line or a station, and for a specific time period. By clicking on any of the category, a filter will be applied on all the widgets of the Dashboard: this is particularly useful, for example, to see the specific alerts, the worst hit units...

- The widget Alert List :lists all the Alerts that have been received by DeMeter - It will show all the Alerts that fit with the current filter.
 The column settings can also be customised to fit your requirements: simply click to expand the option list then click on Manage Headers.
 A list of the available columns will open for you to choose from.
 - Top Alerts widget: the widget reports, over a time period and for a specific factory, the most commonly raised alerts, the number of time they were raised and the device they were raised on. This allows you to focus on the key events lowering your factory's efficiency.

- Alert repartition on the worst Tightening Units widget: the widget highlights which tightening units is the worst hit by alerts based on their respective category. It is therefore possible to assess which units are holding back the production, or maybe in need of maintenance.

- Tightening Units Overview widget: it shows the Tightening Units with the most Alerts, alongside their respective alert level.

- Worst Alerts/Connectors widget : shows a heatmap with the alerts vs the worst connectors.

Any of the aforementioned widget can be added to an existing dashboard, providing there is enough free space to do so: simply drag it to the target Dashboard, save then Apply
Note: keep in mind that each dashboard can be adjusted to display information over a specific time frame and for a specific location at the factory (or the whole factory if needed). You can therefore adapt on the fly the display to match your needs.
4 - Further reading
The following articles may provide further details on the subject: